I’m collecting some disk speed tests on hardware (mostly SD cards), to truly understand the real speed Vs the advertised speed.
For testing I’ll use CrystalDiskMark (you can download it here: http://crystalmark.info/software/CrystalDiskMark/index-e.html). The portable version is fine.
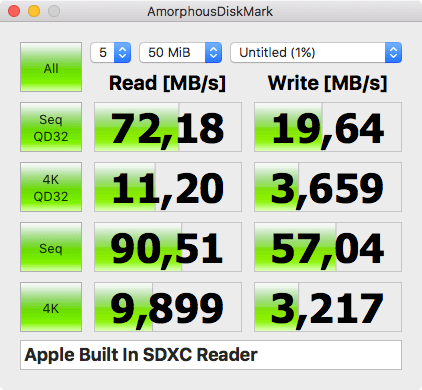
Under Mac, I’ll use AmorphousDiskMark: it’s a “clone” of CrystalDiskMark.
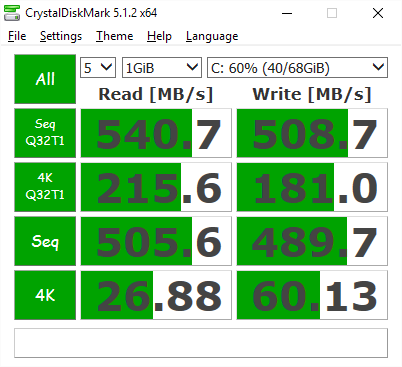
For reference, this is the speed test on my SSD
Samsung SSD 840 EVO 250GB

* MB/s = 1,000,000 bytes/s [SATA/600 = 600,000,000 bytes/s]
* KB = 1000 bytes, KiB = 1024 bytes

   Sequential Read (Q= 32,T= 1) :   540.695 MB/s
  Sequential Write (Q= 32,T= 1) :   508.687 MB/s
  Random Read 4KiB (Q= 32,T= 1) :   215.583 MB/s [ 52632.6 IOPS]
 Random Write 4KiB (Q= 32,T= 1) :   180.954 MB/s [ 44178.2 IOPS]
         Sequential Read (T= 1) :   505.612 MB/s
        Sequential Write (T= 1) :   489.657 MB/s
   Random Read 4KiB (Q= 1,T= 1) :    26.878 MB/s [  6562.0 IOPS]
  Random Write 4KiB (Q= 1,T= 1) :    60.125 MB/s [ 14679.0 IOPS]

  Test : 1024 MiB [C: 59.6% (40.5/67.9 GiB)] (x5)  [Interval=5 sec]
  Date : 2016/03/20 12:00:46
    OS : Windows 10  [10.0 Build 10586] (x64)
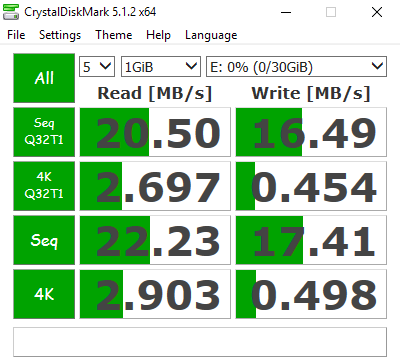
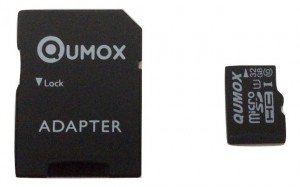
Qumox 32GB MICRO SD CLASS 10 UHS-I

* MB/s = 1,000,000 bytes/s [SATA/600 = 600,000,000 bytes/s]
* KB = 1000 bytes, KiB = 1024 bytes

   Sequential Read (Q= 32,T= 1) :    20.497 MB/s
  Sequential Write (Q= 32,T= 1) :    16.488 MB/s
  Random Read 4KiB (Q= 32,T= 1) :     2.697 MB/s [   658.4 IOPS]
 Random Write 4KiB (Q= 32,T= 1) :     0.454 MB/s [   110.8 IOPS]
         Sequential Read (T= 1) :    22.230 MB/s
        Sequential Write (T= 1) :    17.408 MB/s
   Random Read 4KiB (Q= 1,T= 1) :     2.903 MB/s [   708.7 IOPS]
  Random Write 4KiB (Q= 1,T= 1) :     0.498 MB/s [   121.6 IOPS]

  Test : 1024 MiB [E: 0.0% (0.0/29.5 GiB)] (x5)  [Interval=5 sec]
  Date : 2016/03/20 11:35:47
    OS : Windows 10  [10.0 Build 10586] (x64)
Sandisk Ultra MicroSDXC 128 GB – SDSQUNC-128G-GN6MA

